YOUR POWERHOUSE FOR
DIGITAL MARKETING SOLUTIONS (MAY)
State of the Screens:
TV Viewing Info

How Do We Receive TV in 2022?
Big question #1: How do Americans receive television?
Share of U.S. TV households by a source according to Nielsen:
1) Traditional pay-tv - 57%
2) Broadband-only - 27%
3) Antenna (OTA) - 15%
Big question #2: Does this split impact data collection for measurement?
Quick answer: Yes. These same trends are fragmenting sources available for video ad measurement.
Share of U.S. TV households by device technology according to CIMM:
1) Set-top box w/ Smart TV ACR - 42%
2) Set-top box wo/ Smart TV ACR - 34%
3) Smart TV ACR only - 13%
4) Neither set-top box or Smart TV ACR - 11%

Big question #3: Does the amount of daily time spent with TV change by source?
Quick answer: Yes. Traditional pay-TV households watch 2X the amount of TV as broadband-only households.
Daily time spent with TV by source:
1) Traditional pay-TV - 5h 7m
2) Antenna (OTA) - 3h 50m
3) Broadband-only - 2h 53m
Big question #4: How many different services do people use to watch TV?
The average number of TV sources (YoY growth) according to HUB Entertainment Research:
1) 2018 - 3.0
2) 2019 - 3.7 (↑ 23%)
3) 2020 - 4.8 (↑ 30%)
4) 2021 - 5.7 (↑ 19%)
5) 2022 - 7.4 (↑ 30%)
Big question #5: Do antenna (OTA) homes also use streaming?
Quick answer: Yes. 73% of antenna (OTA) homes have some form of streaming.
Big question #6: Do OTA households differ by age/income?
Quick answer: Yes. OTA households without streaming are 12+ years older with a 54% lower average income.
Big question #7: Does the share of over OTA homes differ by the market?
Quick answer: Yes. A household in Albuquerque (31%) is 4X more likely to be
OTA than in Boston (8%).
Why this matters: Local is complicated/fragmented. The same target consumes video content differently by the market, which requires a unique media plan for each.
Will 7M Viewers Follow Dancing With The Stars to Disney+?
Big news #1: Dancing with the Stars (DWTS) will air exclusively on Disney+ starting with season #31.
Why this matters #1: DWTS has occupied the 8-10 PM time slot on ABC for the past 15 years.
Why this matters #2: DWTS is still a top 5 unscripted show drawing 7M+ viewers each Monday night.
Total viewers for Dancing With The Stars on Mondays (YoY growth) according to Nielsen:
1) S4 - 20.0M
2) S5 - 21.7M (↑ 8%)
3) S6 - 19.6M (↓ 10%)
4) S7-8 - 19.8M (↑ 1%)
5) S9-10 - 19.7M (↓ 0%)
6) S11-12 - 21.9M (↑ 11%)
7) S13-14 - 18.2M (↓ 17%)
8) S15-16 - 14.9M (↓ 19%)
9) S17-18 - 15.2M (↑ 2%)
10) S19-20 - 14.7M (↓ 3%)
11) S21-22 - 13.4M (↓ 9%)
12) S23-24 - 12.4M (↓ 8%)
13) S25-26 - 10.6M (↓ 14%)
14) S27 - 8.7M (↓ 18%)
15) S28 - 7.8M (↓ 10%)
16) S29 - 7.1M (↓ 10%)
Big in Lil Screens world: Disney released a trailer for the upcoming Obi-Wan Kenobi limited series.
Disney streaming subscribers by platform (% of total):
1) Disney+ - 137.7M (67%)
2) Hulu – 45.6M (22%)
3) ESPN+ - 22.3M (11%)
4) Total – 205.6M
Total Disney streaming subscribers (YoY growth):
1) 2021-Q1 – 159.0M
2) 2022-Q1 – 205.6M (↑ 29%)
Monthly ARPU for Disney+ (YoY growth):
1) 2020-Q1 - $5.63
2) 2021-Q1 - $3.99 (↓ 29%)
3) 2022-Q1 - $4.35 (↑ 9%)
Monthly ARPU for Hulu (SVOD only)(YoY growth):
1) 2020-Q1 - $12.06
2) 2021-Q1 - $12.08 (↑ 0%)
3) 2022-Q1 - $12.77 (↑ 6%)
Monthly ARPU for Hulu (Live TV + SVOD)(YoY growth):
1) 2020-Q1 - $67.75
2) 2021-Q1 - $81.83 (↑ 21%)
3) 2022-Q1 - $88.77 (↑ 8%)
Monthly ARPU for ESPN+ (YoY growth):
1) 2020-Q1 - $4.24
2) 2021-Q1 - $4.55 (↑ 7%)
3) 2022-Q1 - $4.73 (↑ 4%)
Big news #2: Disney is giving an early glimpse of an offering that ties together DTC streaming (Disney+) with offline assets (theme parks).
Big question #1: What are the demographics around people showing interest in the Obi-Wan Kenobi limited series on Disney+?
Quick answer: Male (65%) and heavily 18-34 (82%).
Disney+ subscribers (YoY growth):
1) 2020-Q1 - 54.5M
2) 2021-Q1 – 103.6M (↑ 90%)
3) 2022-Q1 – 137.7M (↑ 33%)
Big question #2: Which region is growing fastest for Disney+?
Quick answer: India.
Disney+ YoY growth rate by region:
1) India (Hotstar) -↑ 42%
2) International (non-Hotstar) - ↑ 39%
3) US/Canada -↑ 19%

Big question #3: How many shows is Disney+ developing for international markets?
Quick answer: 590 shows.
Number of international shows in production
by region (% of total):
1) Latin America (LATAM) - 200 (34%)
2) Europe, Middle East, and Africa (EMEA) -
150(25%)
3) Asia Pacific (APAC) - 140 (24%)
4) India - 100 (17%)
MEET OUR NEW MEMBERS!
Graduated Bachelor Of Science in Criminology with Masters in Public Administration, He is from the Philippines.
Alexis worked in the customer service field for 10 years, He worked as an Operations Manager for one of the largest contact centers in the Philippines. He is also an experienced marketer as he recently worked for Google Ads as an Account strategist, He helped a number of businesses in different fields and niches to achieve their marketing goals
My name is Madison Ankiewicz. I live in Florida, but was born and raised in Hampton Roads Virgina. I am a proud graduate of Seton Hall University where I was lucky enough also be a student athlete for all four years.
When I'm not working I am either working out, doing triathlons or working on my farm. I enjoy being outside and also spending time with my family and our three dogs
Eric is a graduate of Boston University with a BA in Computer Science and a MS in Management Studies. Originally a Maryland native, Eric is currently based out of
Boston, MA.
Professionally, Eric has worked as a software developer and consultant for several companies in the fortune 500. He specializes in automation and helps Orbit Interactive to improve their processes.
Outside of work, Eric enjoys rock climbing, eating food, and snowboarding in the winter. He spends the rest of his remaining time running around New England with his friends and his mini aussie, Meeko, and catching up on his favorite shows.

Google Adds More Custom Relevance Signals to Local Results
How people are watching TV is a major factor in the success of OTT/Streaming TV. This is Locals Money to Lose so make sure you understand the possibilities.
Google My Business is shifting again- and this shift will help local business to be found. But they need help to do it right- help clients by adding GMB services each month.
Google’s local team has been on a tear recently when it comes to new features, experiments, and expansions of existing functionality.
Recent developments include a dramatic expansion in shoppable product photos within the Local Pack as well as a new “Browse by-product” and “Browse by store” interface within the Local Finder (primarily on mobile devices) that melds Google Shopping with local results to an unprecedented degree.
Google has even updated its help documentation on how businesses can improve their local ranking, now suggesting that the presence of product listings may help businesses outrank the competition.
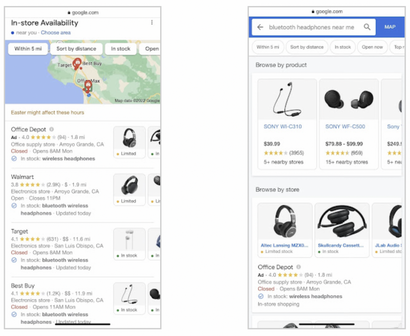
Shoppable product photos in the Local Pack and Local Finder
Products in the Local Pack and Local Finder are showcased in the form of carousels dominated by product photos, aligning Google’s expanding effort to digitize local store inventory with its emphasis on visual components in local results.
Visual cues are also showing up in more and more places, with Google making use of its sophisticated image recognition technology to pull relevant photos from the photo galleries within Google Business Profiles in order to display them directly in the Local Pack and Local Finder.
There’s another common thread here besides the increased emphasis on visual media. On the topic of local ranking, Google has long identified three primary areas of evaluation that its local algorithm applies when deciding how to rank a business for a particular search.
These are relevance, distance (or proximity), and prominence. Relevance is an answer to the question, “Does this business meet the need indicated by the search query?” Distance answers the question, “Is this business among the nearest good examples matching the search query?” And finally, prominence answers the question, “Is this business an excellent example of its type?”
The ranking criteria that matter most for the current discussion are relevance. In offering product photos to users searching for products, Google is both declaring and emphasizing that this business has offerings relevant to the searcher’s stated need.
The evidence points to relevance as a huge priority for Google these days. The examples already cited belong to an even larger trend many of us have been tracking since early 2019. Around that time,
Google’s internal teams are said to have coined the term “justifications” to describe what is now commonplace in local results:
text snippets sourced from the Google profile, the business website, and even
Google users, appended to the listing in the Local Pack and Finder in order to show that the listing matches query intent.
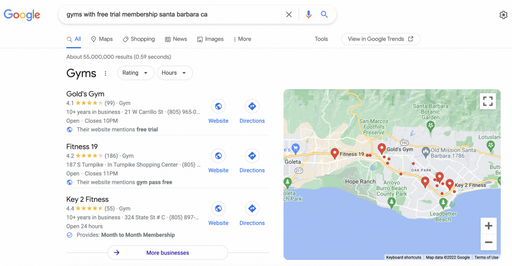
A search for “gyms with free trial membership” shows justifications from the business website (“Their website mentions”) and from GBP service attributes (“Provides”)
Justifications are now extremely common, not only in niche searches like the example above but even in results for more generic queries like “Italian restaurant near me.” And it’s easy to see that, although they are not often described using this term, shoppable product photos and other types of photo content in Google results function in a manner that is highly similar to justifications. Again, the key is relevance: in all cases, Google is creating a result tailored to search intent that is designed to prove the relevance
of the business.
In some more recent examples gathered by my colleague Michael Snow, Google is going even further to push relevance and anticipate consumer demand.
Overlapping the theme of increased relevance signals is the theme of customized search results, where one searcher may see something different from another depending on factors like search intent.
Time is another of these factors. In addition to photos, justifications, and post carousels, Google is peppering local results these days with indicators that customers are visiting the business and that the business is providing timely updates.
Examples include flags in listings indicating how recently hours of operation and other details were last updated, as well as prominent callout sections such as “Updates from customers” and “From the owner” that display recently uploaded content. These callout sections are triggered by shared photos from users and “what’s new” Google Posts from business owners, which also generally feature photos — again showing Google’s emphasis on visuals.
With all of this customization, Google listings are now not static entities but are designed with flexibility in mind so that factors like search intent and timeliness can be taken into account. Presumably, all of this is leading to higher conversions.
Certainly Google’s efforts have made its local search offerings more sophisticated than ever and have placed even more distance between Google and its competition.
In the search below for “Nike air near me,” Google pulls relevant content from offer-type Google Posts associated with a listing and displays that content both as a justification style snippet in the abbreviated profile on the left and as an expanded carousel of Google Posts in the full business profile.
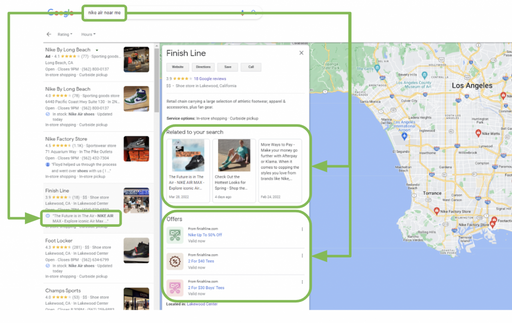
Google showcasing offer content relevant to Nike Air and other offerings
And Google doesn’t stop there. In this example and others Michael was able to uncover, Google is highlighting another set of offers lower down in the business profile that appear to be sourced from the business website, with custom deal icons applied by Google. These offers may not all be directly related to the search, though the first of them suggests that the store is offering Nike products at 50% off. The rest may serve as further enticement to visit the business.
The appearance here of offer-type Google Posts is not accidental. Google is showcasing this post type more prominently in search lately, sometimes under the heading Offers. In many cases there is not such an obvious tie to search intent as what we see here, where the Nike Air brand is found both in the query and the first offer.
Google seems to be offering slightly less relevant content if that’s the only content available, hoping it will be close enough.
GET READY FOR INSTA E-COMMERCE SITES FOR CLIENTS
Google Is Using AI to Improve
Business Listings — Here’s How

It happens all the time. Someone searches for a business on Google, stumbles upon an outdated Maps listing, and arrives at a time when the business is closed. Frustration ensues, often followed by a series of negative online reviews.
Outdated online listings are the bane of consumers and business owners everywhere. And yet, with store hours changing frequently during the pandemic, it’s been a monumental task for businesses to keep their listings updated across all major directories and platforms.
That makes Google’s recent announcement intriguing, especially for multi-location brands. In a blog post, the company said it would be using artificial intelligence and machine learning to build a self-updating Maps product that predicts when business hours are likely to be wrong and updates listings automatically using AI-generated predictions.
How Google’s approach to local info has evolved
Thanks to its vast size and market share, Google Maps has become one of the most important sources of business information for consumers online. Google Maps has more than 154 million monthly users, with users contributing more than 20 million pieces of new information each day.
“Business hours are one of the most dynamic elements within your Google Business Profile and likely the most susceptible to errors or change,” says Krystal Taing, Senior Manager of Solutions at Uberall.
Google has traditionally relied on third-party sources of data for business listings when businesses have not provided a complete data set. Now, that strategy is set to change. In a description on its website, Google says its systems consider multiple factors to predict outdated store hours, including when the business profile was last updated, other online information about the stores’ hours, and information from the Popular Times data Google collects about most businesses in the U.S.
Google’s Popular Times product has been live for more than two years, using aggregated and anonymized location history data from consumers to calculate how busy specific businesses typically are for every hour of the week. Google’s location data is collected exclusively from consumers who have optedin through their Google accounts. A business’ busiest hour becomes the benchmark, and Google displays “busyness” data for every other hour of the week relative to that data.

This Popular Times feature takes center stage in Google’s latest move. As an example, if it’s determined that a business is especially busy on Monday afternoons, but the business’ Google Listing shows it being closed during that time, then Google now has the ability to override the outdated listing information based on its own consumer location data.

Google will also be using information about competitors’ businesses in its new AI product. If similar businesses are open at a certain day and time, the algorithm sees that as an indication that a business listing is likely to be outdated as well. The company expects to update the store hours for more than 20 million businesses around the globe in the next six months.
“Google also derives many of its innovations based on search patterns and behaviors they know about users, so they likely are seeing a shift in searches as well as what users are interacting with most on Google Business Profiles,” Taing says.
Despite its heavy reliance on location data and machine learning, Google is also enlisting the help of its Google Maps community to guide its decision making on when to update business listings. Local Guides and business owners themselves, through their Google Business Profile, will be asked to verify the information that Google’s algorithm predicts. In certain countries, including the United States, Google is using Duplex conversational technology to call businesses and ask for their hours directly.
What’s at stake in Google’s Maps policies
A lot is at stake. Google earns more than 80% of its revenue from ads, and it commanded 29% of digital ad spending globally in 2021. If this new Google Maps strategy leads to an increase in inaccurate listings, frustrated business owners could take their advertising dollars elsewhere.
In the meantime, Taing suggests that businesses keep a close eye on their listings and monitor their profiles regularly to look for signs of irregularity.
“Maintaining your data on Google Business Profiles and all other physical and digital properties is still essential, even if Google is using AI to update some of this information on their own,” Taing says. “If Google is getting consistent updates from your business, they will be less inclined to rely on other sources. However, if Google does look to supplement your business hours by relying on other sources, it will be critical to ensure this information is correct.”