YOUR POWERHOUSE FOR
DIGITAL MARKETING SOLUTIONS

Refocusing the Contextual Advertising
Conversation on Outcomes

The quality signals that are appropriate for every given campaign are determined by the advertiser's objectives. The beauty of the measures presented is that they may all be optimized in real-time during the campaign's life cycle to achieve desired results. In this aspect, contextual targeting isn't a departure from the cookie-based audience targeting that marketers have grown to expect. In the end, it's all about the results.
As the sunsetting of third-party cookies approaches, many adtech leaders are heralding contextual targeting as the alternative of choice.

 Marketers and organizations are nervous about the forthcoming disruption to “business as usual” as it relates to driving and measuring advertising ROI. But that’s only because our industry is having the wrong conversations. We need to stop talking about audiences versus context.

 We need to stop talking about programmatic versus managed services. We need to stop talking about deterministic versus probabilistic. These dichotomies are creating the perception of a wholesale industry upheaval when, in fact, marketers’ ability to do what they truly need to do won’t be changing all that dramatically.

 It’s time to stop getting hung up in the jargon. Instead, let’s talk about what really matters to marketers: outcomes and how to secure them. 

An article might be marked as being relevant to sports enthusiasts, but how much of the content is actually about sports? A confidence score is a quality indicator of how well the content aligns with the desired audience
Recency: In contextual, recency serves as a reliable proxy for audience value and interest. We know that many categories of online content — sports, for example — tend to be read within hours of publication. The value of timely content diminishes quickly, as does the value of the eyeballs it reaches. Thus, to understand the quality of contextual impressions, marketers need to understand the recency of the content around which their ads appear.
Sentiment: Taking this a step further, marketers need to consider the sentiment of the content around which they advertise. Is the topic of relevance spoken about in a positive, neutral, or negative way? Again, this measure helps brands understand the true value of their impressions.
Brand Safety: Measures of brand safety enable marketers to protect their brand reputation within their media buys by ensuring the content they advertise around is not only safe but also suitable for their desired audience.
Viewability: Of course, quality extends to the placement of the ad unit itself. In this regard, viewability remains an essential measure of quality within the contextual space. The quality signals that make sense for any given campaign depend on the goals of the advertiser. The beauty of the above measures is that they can all be optimized, in real-time, over the life of the campaign to drive desired performance. In this regard, contextual targeting isn’t a deviation from what marketers have come to expect from their cookies-based audience targeting. In the end, it’s still all about outcomes.

Branding or Performance? It’s All About Outcomes

All brands and agencies want to hit their goals, whether those goals are built around the concept of branding or performance. But even that dichotomy is becoming increasingly irrelevant, as even the direct-toconsumer brands built on the foundation of direct-response revenue have evolved their models to recognize the long-term necessity of brand building.

 Most of the traditional binaries in digital advertising are breaking down and giving way to a hybrid, more holistic future that’s based on relevance. Marketing comes down to outcomes and determining the right way to gauge success based on a brand’s and campaign’s goals. Producing desired outcomes depends on quality metrics, including the following:
Attention: Thanks to historical data from cookie-based brand lift studies, we already have a detailed understanding of how effective certain ad placements are at capturing and holding a reader’s attention. As such, in contextual advertising, attention measures can serve as an effective proxy for brand lift.
Confidence: Marketers also need to understand how well a given article or piece of content indexes against the audiences they’re trying to reach.

WE HAVE TWO NEW AD OPERATIONS MEMBERS!

Manaswi

"Digital marketing enthusiast, artistic at heart, a cheerful
human being with an outlook to learn from every
opportunity, meeting, and experience.

Gurjot

I’m a Tech enthusiast, avid photographer, and have
an eagerness to learn personalities. I also have 2
years of experience in sales and have an overall jolly
attitude towards everything.

Universal Analytics will be going away

We strongly advise that you switch to Google Analytics 4 as soon as possible. As a result, you'll be able to build the essential historical data and use in the new experience, ensuring that you have a smooth transition once Universal Analytics is no longer available.
Google Analytics 4 is our next-generation measurement solution, and it's replacing Universal Analytics. On July 1, 2023, standard Universal Analytics properties will stop processing new hits. If you still rely on Universal Analytics, we recommend that you prepare to use Google Analytics going forword.

Understand what's going to
happen

  • Until July 1, 2023, you can continue to use and collect new data in your Universal Analytics properties
  • After July 1, 2023, you'll be able to access your previously processed data in your Universal Analytics property for at least six months. We know your data is important to you, and we strongly encourage you to export your historical reports during this time.
  • In the coming months, we'll provide a future date for when existing Universal Analytics properties will no longer be available. After this future date, you'll no longer be able to see your Universal Analytics reports in the Analytics interface or access your Universal Analytics data via the API.
Google Analytics 360 properties will receive a one-time processing extension ending on October 1, 2023.

Check if your Google
Analytics property is impacted

  • If you created your property before October 14, 2020, you're likely using a Universal Analytics property.
  • If you created your property after October 14, 2020, you're likely using a Google Analytics 4 property already, and no action is required.

Complete your next steps

We strongly encourage you to make the switch to Google Analytics 4 as soon as possible. Doing so will allow you to build the necessary historical data and usage in the new experience, preparing you for continuity once Universal Analytics is no longer available.

Unstructured Data
Becomes an Untapped
Opportunity for Brands

A great reason to use our new and Improved Rep
Management is to help client use their data to be more
competitive as well as convert clients better and get more
referrals.

The biggest data asset for companies in 202 might also be one of the least recognized.

Unstructured data now represents 80% to 90% of all new enterprise data, according to Gartner, but just 18% of organizations are taking advantage. Unstructured data, like product images, customer audio files, and comments from social media, represents an untapped opportunity for marketers.

“Every company has large amounts of unstructured data at their disposal—about their brand and the competitive landscape— from public forums such as review sites, rating pages, and comments on various social media channels,” says Pranav Desai, chief product officer at Reputation. “However, sifting through all of that information to find insights is time-consuming and challenging.”

Reputation’s Competitive
Intelligence Solution

With the launch of a new competitive solution, Reputation is hoping it can bring unstructured data into the mix for mainstream organizations.

The volume of unstructured data flowing into business in 2022 has never been greater, and surveys show that executives who say unstructured data is one of the most valuable sources of insights are more likely to exceed their business goals

Understanding Unstructured Data

Whereas structured data is focused on a fixed field and explicitly defined, unstructured data is generally not organized in a predefined manner. That means it can come from anywhere at any time. Desai says unstructured data unlocks deeper insights than structured data, but since it can come from a variety of listening posts and is qualitative in nature, it is difficult and timeconsuming to distill. 

“The brands that invest in the time and tools to do so will unlock troves of insights that can grow the bottom line—and those are the brands that will ultimately beat their competition,” Desai says.

Deeper insight into competitors should allow organizations to better understand their strengths and weaknesses, as well as those of their competitors, and to further identify opportunities in the market going forward. For example, Desai says a brand that notices that a competitor does not have a strong social customer care program, and sees customers talking about that on social media, could use the information to make the right investments to improve that function on their end, and ultimately attract new customers

Reputation’s solution, which debuted earlier this month, allows companies to learn the ‘why’ behind their competitions’ online reputation, with the ultimate goal of gaining a competitive advantage by targeting customers based on market trends.

Desai says investing in competitive intelligence allows businesses to more efficiently find their own “golden nugget” to inform their strategies, which results in actions that foster growth.

Reputation’s competitive intelligence solution is a standalone product that pairs with the company’s RXM suite of products. It uses deep machine learning and natural language processing to aggregate competitor customer feedback.

Users can compare their businesses to competitors and discover more about the market. Competitor ratings, online review comments, category, and sentiment trends all play a role, as do “impact indicators” by location to help brands understand strengths, weaknesses, and opportunities within their markets.

Desai hopes to see brands using these actionable insights as fuel to help deliver the right experiences at the right time for customers, and to drive better overall business performance.

Tapping into unstructured data for competitive insights puts Reputation in the unique position of working to push the industry in a new direction, rather than capitalizing on a trend that’s already got momentum behind it.

“Customers have become accustomed to doing nearly everything online—they expect a digital experience that involves low effort on their end and speedy resolutions to issues,” Desai says.

“Some companies—often the leaders in their space—have invested in the right tools and platforms to do this, but others have not. As we move forward, this trend will stay with us, and organizations that take an insights-based approach to improve the customer experience will remain relevant long-term.”

The Latest Edition of State of the Screens

55 Billion Reasons to Care
About Local Video Ads

Big question #1: How large is the video ad market in the United States?

U.S. video ad market (% change):
1) 2022 - $136B
2) 2025 - $167B (↑ 23%)

Digital share of U.S video ad market:
1) 2022 - 51%
2) 2025 - 65%
Big question #2: How large is the local video ad market in the United States?

U.S. video ad market (% of total) by geographic targeting:
1) National - $81B (59%)
2) Local - $55B (41%)

Why this matters: The local video ad market is larger ($55B) than most people understand. It is more fragmented than the national ad market, with 210 individual markets and 800Xthe number of advertisers.
PSA #2: CTV/OTT is early in its growth curve with local advertisers.
U.S. local video ad market (% of total) by screen type:
1) Broadcast - $19B (34%)
2) Mobile/Desktop - $12B (22%)
3) Social Video - $11B (20%)
4) CTV/OTT - $9B (15%)
5) Cable - $5B (9%)
6) Total - $55B
Big question #3: How many local video ad buyers are in the United States?
Digital share of U.S. video ad market by geographic targeting:
1) Local - 57%
2) National - 48%
Why this matters: This makes sense when you consider how important digital's ability to target by geography (zip codes, distance from a location, etc.) is to local advertisers and has little value to national advertisers
PSA #1: This lines up with data from Borrellthat shows CTV/OTT as the most-indemand digital product in 2022.

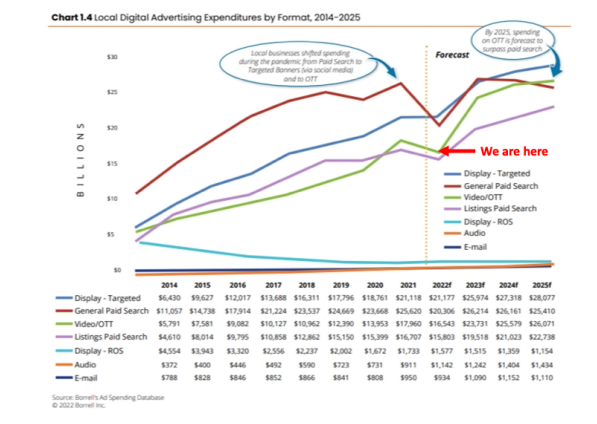
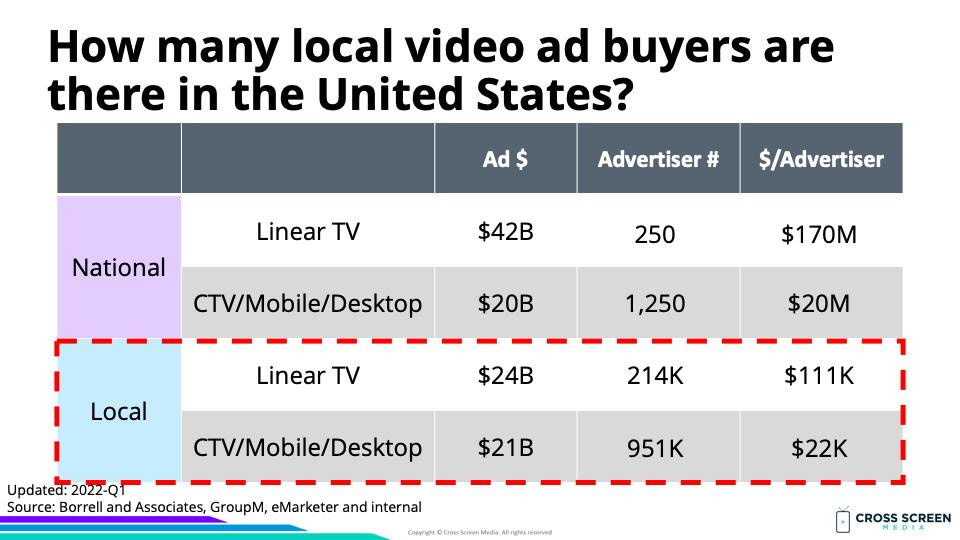
Estimated number of video ad buyers:
1) Local Digital - 951K
2) Local Linear - 214K
3) National Digital - 1.3K
4) National Linear - 250


Annual video ad spend per advertiser:
1) National Linear - $170M
2) National Digital - $20M
3) Local Linear - $111K
4) Local Digital - $22K


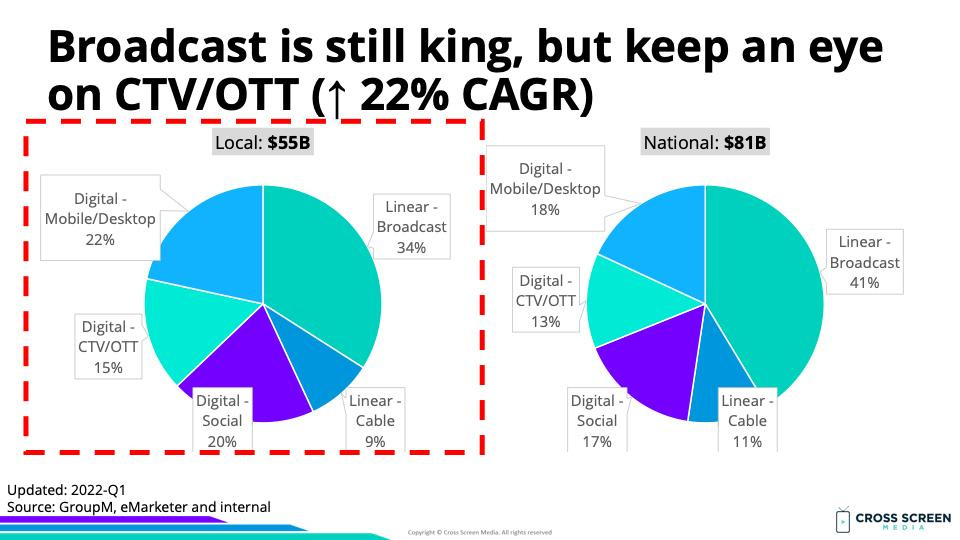
Why this matters #1: The local video ad market is the next battleground for convergent TV. Winning this space will require an offering built specifically for local advertisers. The same ad stack built for national advertisers with an annual video ad spend of $50M+ will not work for local advertisers spending $43K.


Why this matters #2: This is the exact problem we are solving at Cross Screen Media. Our vision is a single video ad platform allowing local advertisers to plan, activate and measure all forms of video advertising across every granular geography.

Estimated number of local video ad buyers (% of total):
1) Digital only - 814K (79%)
2) All video - 137K (13%)
3) Linear only - 77K (8%)
linkedin facebook pinterest youtube rss twitter instagram facebook-blank rss-blank linkedin-blank pinterest youtube twitter instagram